How Nonce Bitcoin Mining Data Aligns With Three Core Metrics in Public Miner Filings
Nonce Bitcoin mining data aligns with public miner filings through three core metrics—BTC production, effective hashrate, and cost per BTC—linking farm operations to how much was produced, what compute was used, and what it cost.

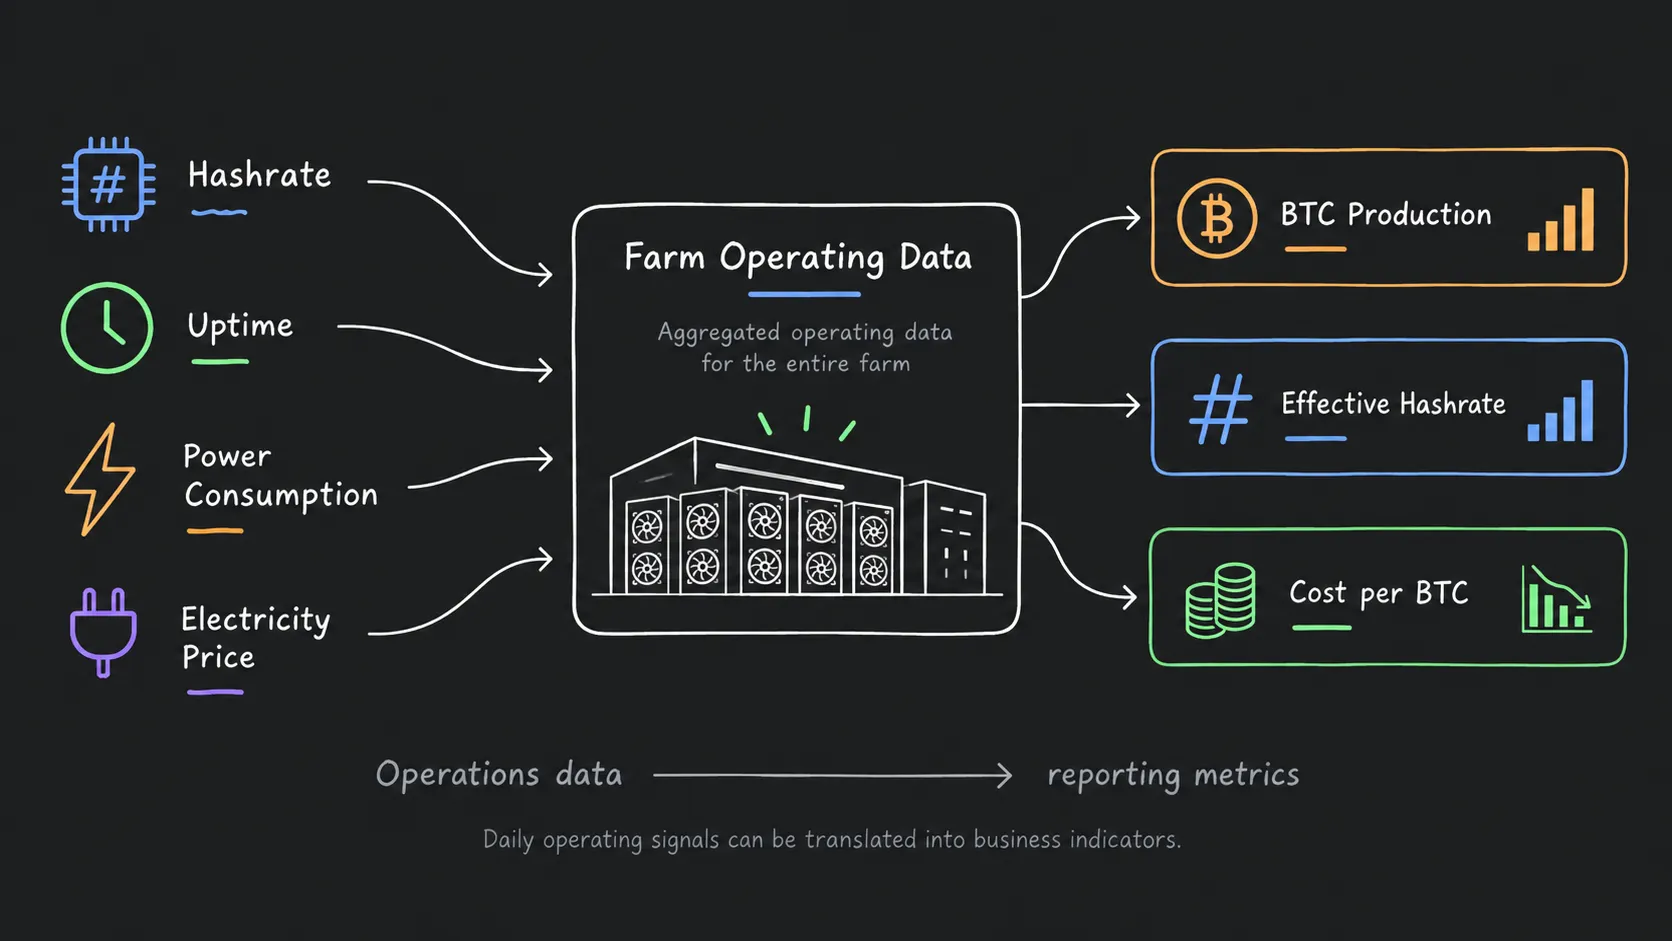
For farm operations teams, what they see every day is miner online status, real-time hashrate, power draw, electricity price, device efficiency, and anomaly counts. In public miners' quarterly filings, investors instead see "how many BTC were produced this quarter," "what operating hashrate was," and "how much it cost to mine one BTC." The two kinds of data look like different systems, but they essentially describe the same Bitcoin production process: how much effective hashrate and electricity were put in, how much BTC was ultimately produced, and how much cost was paid for that BTC.
If you want to use Nonce farm operations data to understand, validate, or even anticipate public miner filings, the metrics most worth aligning are not revenue, net income, or EBITDA, but three core metrics closer to underlying farm operations: BTC production, effective hashrate, and cost per BTC. These three correspond respectively to "how much was produced," "how much computing capacity was used," and "how much production cost was paid," and they are also important dimensions currently tracked by Nonce public miner data. Financial metrics are ultimately affected by BTC price, accounting standards, depreciation, asset impairments, and financing structure, but these three metrics sit closer to a farm's real operating reality.
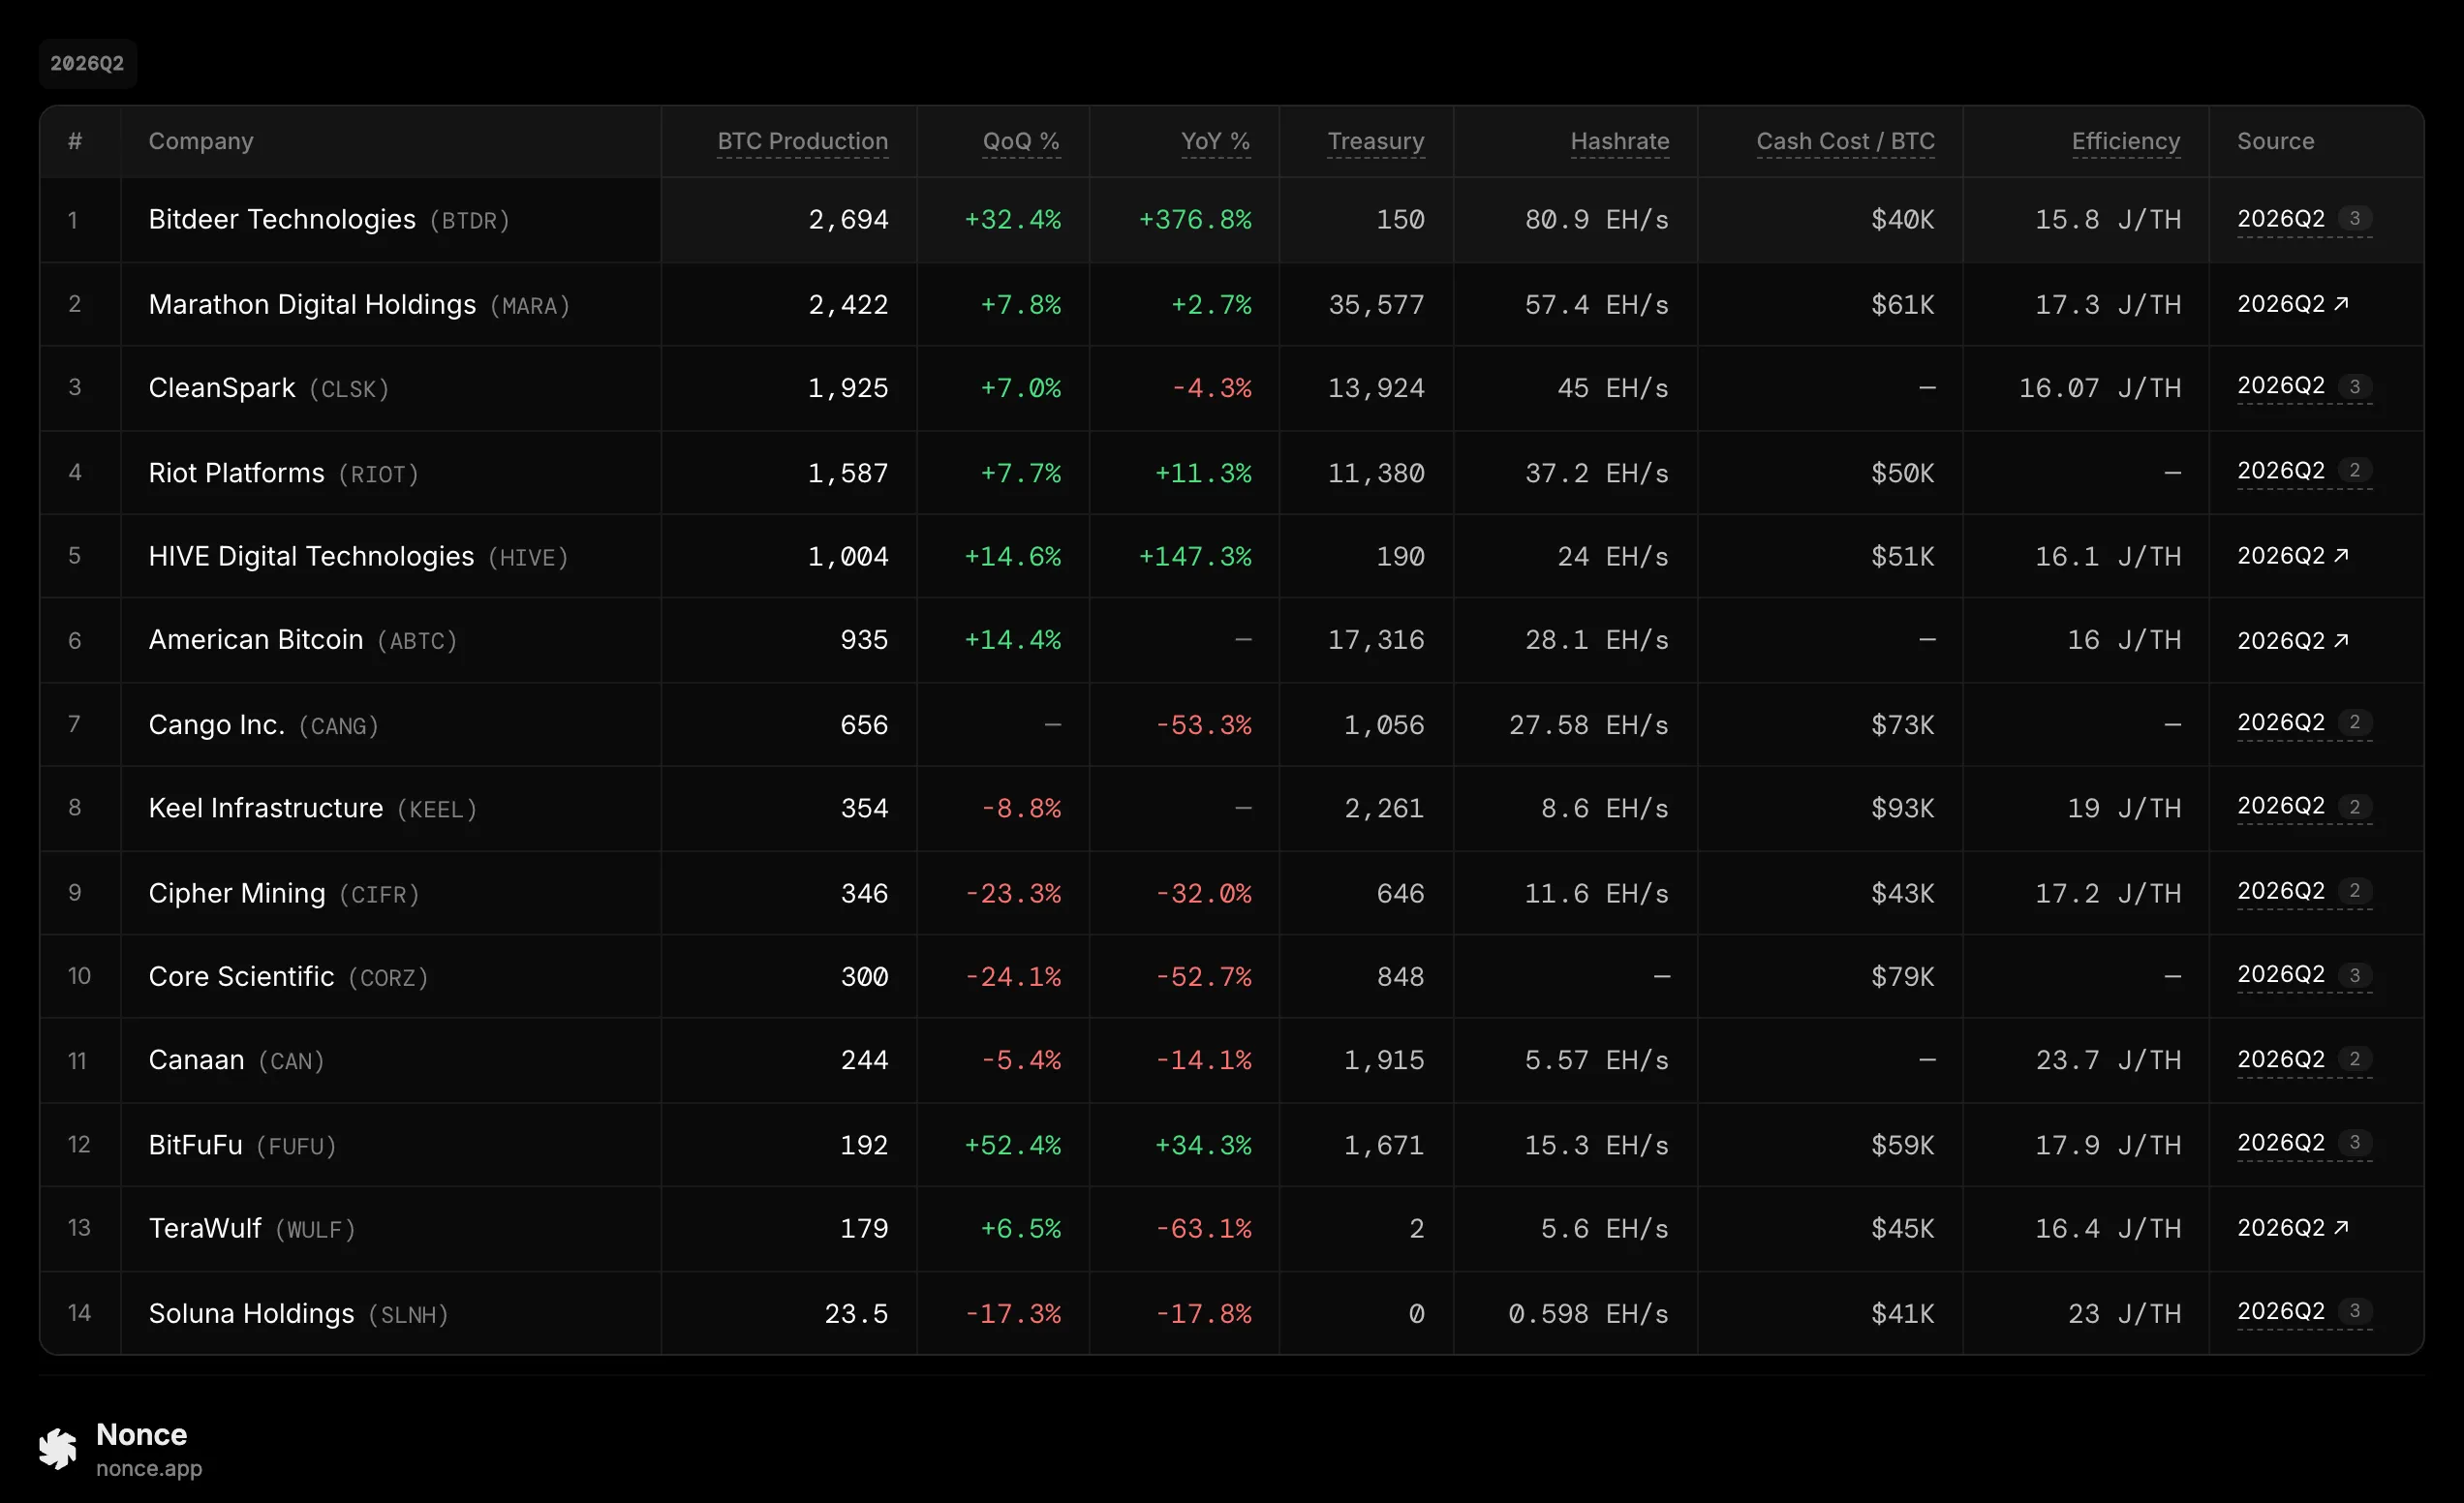
Second-quarter 2026 data illustrates this relationship well. MARA disclosed quarterly production of 2,422 BTC, energized hashrate at period end of 70.3 EH/s, and owned-site power purchase cost per BTC of $38,870; Riot produced 1,587 BTC in the same period and disclosed cost to mine per BTC excluding miner depreciation of $49,912; Bitdeer produced 2,694 BTC, with self-mining hashrate of 73.0 EH/s, and disclosed quarterly total electricity consumption, average electricity price, and miner efficiency. Although the three companies' cost definitions are not fully identical, all can be broken back into the underlying "hashrate—production—cost" logic.
BTC Production
BTC production is the easiest metric to understand, and also one of the easiest to underestimate. For public miners, it means how many bitcoin were actually obtained over a reporting period; for a farm, it is the final result of device uptime, effective hashrate, pool connection quality, network difficulty, and runtime acting together.
Therefore, owning 10 EH/s of hashrate does not mean that hashrate participated in mining at 10 EH/s throughout the quarter. Some miners may contribute incomplete hashrate because of high temperature, disconnects, PSU failures, repairs, curtailment, or intentional downclocking. "Installed hashrate" or even "energized hashrate" shown in a device management system cannot be equated directly with the effective hashrate that ultimately produces BTC.
MARA disclosed 70.3 EH/s of "energized hashrate" for the second quarter of 2026, but its definition of that metric itself emphasizes that this is the hashrate energized miners could produce under theoretical conditions, and may include temporarily offline devices. So 70.3 EH/s is not the actual average hashrate continuously delivered across the whole quarter. MARA produced 2,422 BTC in the same period; these two numbers must be understood together with runtime, network hashrate, and difficulty changes.
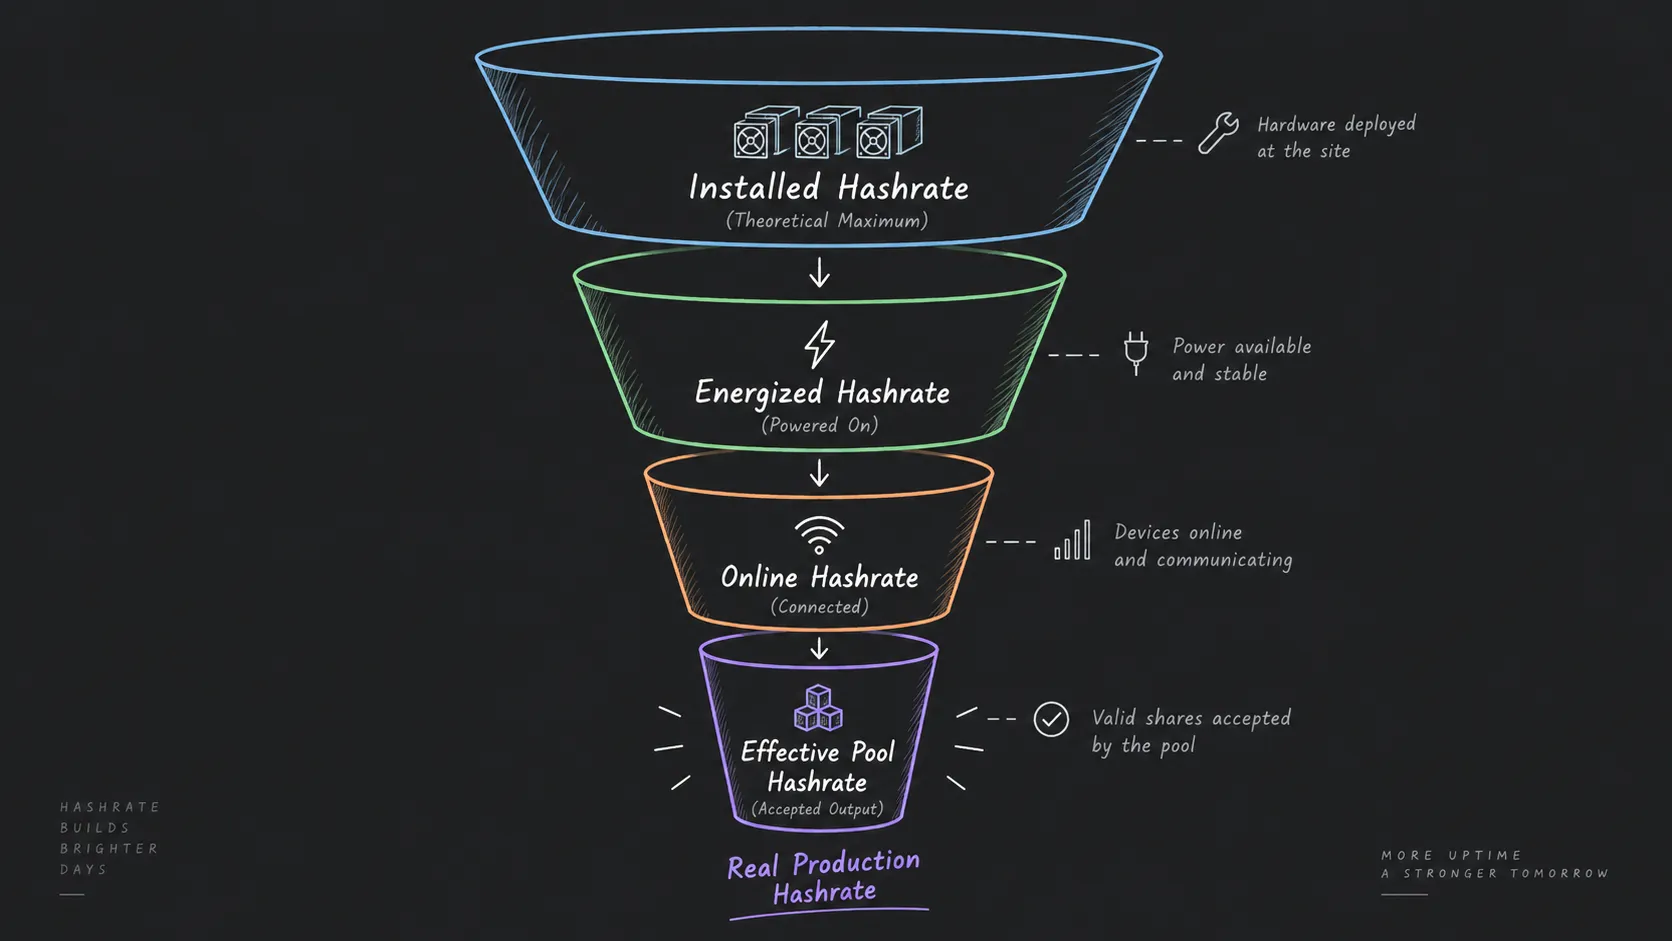
This also explains why farms cannot track only "machine count" or "rated hashrate." What truly needs continuous observation is: how much theoretical hashrate there is, how much is online, what actual average hashrate is, and how much hashrate is ultimately accepted by the pool and converted into BTC.
From a farm operations perspective, this relationship can be simplified as theoretical hashrate → online hashrate → effective hashrate → pool effective share → BTC production
Loss at any link will ultimately show up in quarterly BTC production. For example, if a farm's theoretical hashrate is unchanged but many miners disconnect frequently, the filing will not have a line item called "disconnect loss"—it will simply show fewer BTC produced at the same hashrate scale.
Therefore, when comparing different miners' BTC production in Nonce public miner data, you should not read it only as a production ranking. BTC production is actually the joint result of fleet scale, effective runtime, miner efficiency, network difficulty, and operating capability.
Effective Hashrate
Another metric public miners most often disclose is hashrate, but "hashrate" does not have a fully unified filings definition. Some companies disclose period-end hashrate, some disclose average operating hashrate, some use energized hashrate, and some publish both self-mining hashrate and managed hashrate. Putting these numbers side by side for direct comparison can easily produce misjudgment.
Bitdeer's second-quarter 2026 data is a typical example. The company disclosed period-end self-mining hashrate of 73.0 EH/s, but the average self-mining hashrate used to explain self-mining revenue in Q2 was 69.5 EH/s; in addition, the company also had other owned hashrate, hosting hashrate, and joint-mining hashrate. In other words, "73 EH/s" cannot fully represent the average hashrate actually used that quarter to generate self-mining BTC revenue.
MARA likewise defines energized hashrate as the theoretical hashrate all already-energized devices could produce under ideal conditions, and explicitly notes that temporarily offline miners may still be included in that metric.
Therefore, to truly align farm data with public miner filings, it is best to distinguish at least the following hashrate layers:
| Data definition | What it represents | Suitability for directly measuring BTC production capacity |
|---|---|---|
| Rated hashrate | Theoretical hashrate when miners run to spec | Weaker |
| Deployed hashrate | Theoretical total hashrate of installed equipment | Weaker |
| Energized hashrate | Theoretical hashrate of miners that already have operating conditions | Medium |
| Actual miner-side hashrate | Average hashrate miners actually produce | Stronger |
| Pool effective hashrate | Effective compute contribution actually received by the pool | Very strong |
| Period-average operating hashrate | Average capacity that actually participated in production over the quarter | Best aligned with production |
If a farm expands from 50 EH/s to 60 EH/s but new miners only come online near quarter end, period-end hashrate rises 20%, yet quarterly BTC production cannot rise 20% in sync. Conversely, even if total miner count is unchanged, if offline rate falls, low-hashrate devices are reduced, cooling improves, and operating stability rises so that average effective hashrate increases, BTC production may also increase.
That is why what farm operations truly need to watch is not a single "total hashrate," but what share of rated hashrate is truly converted into continuously effective compute capacity.
Cost per BTC
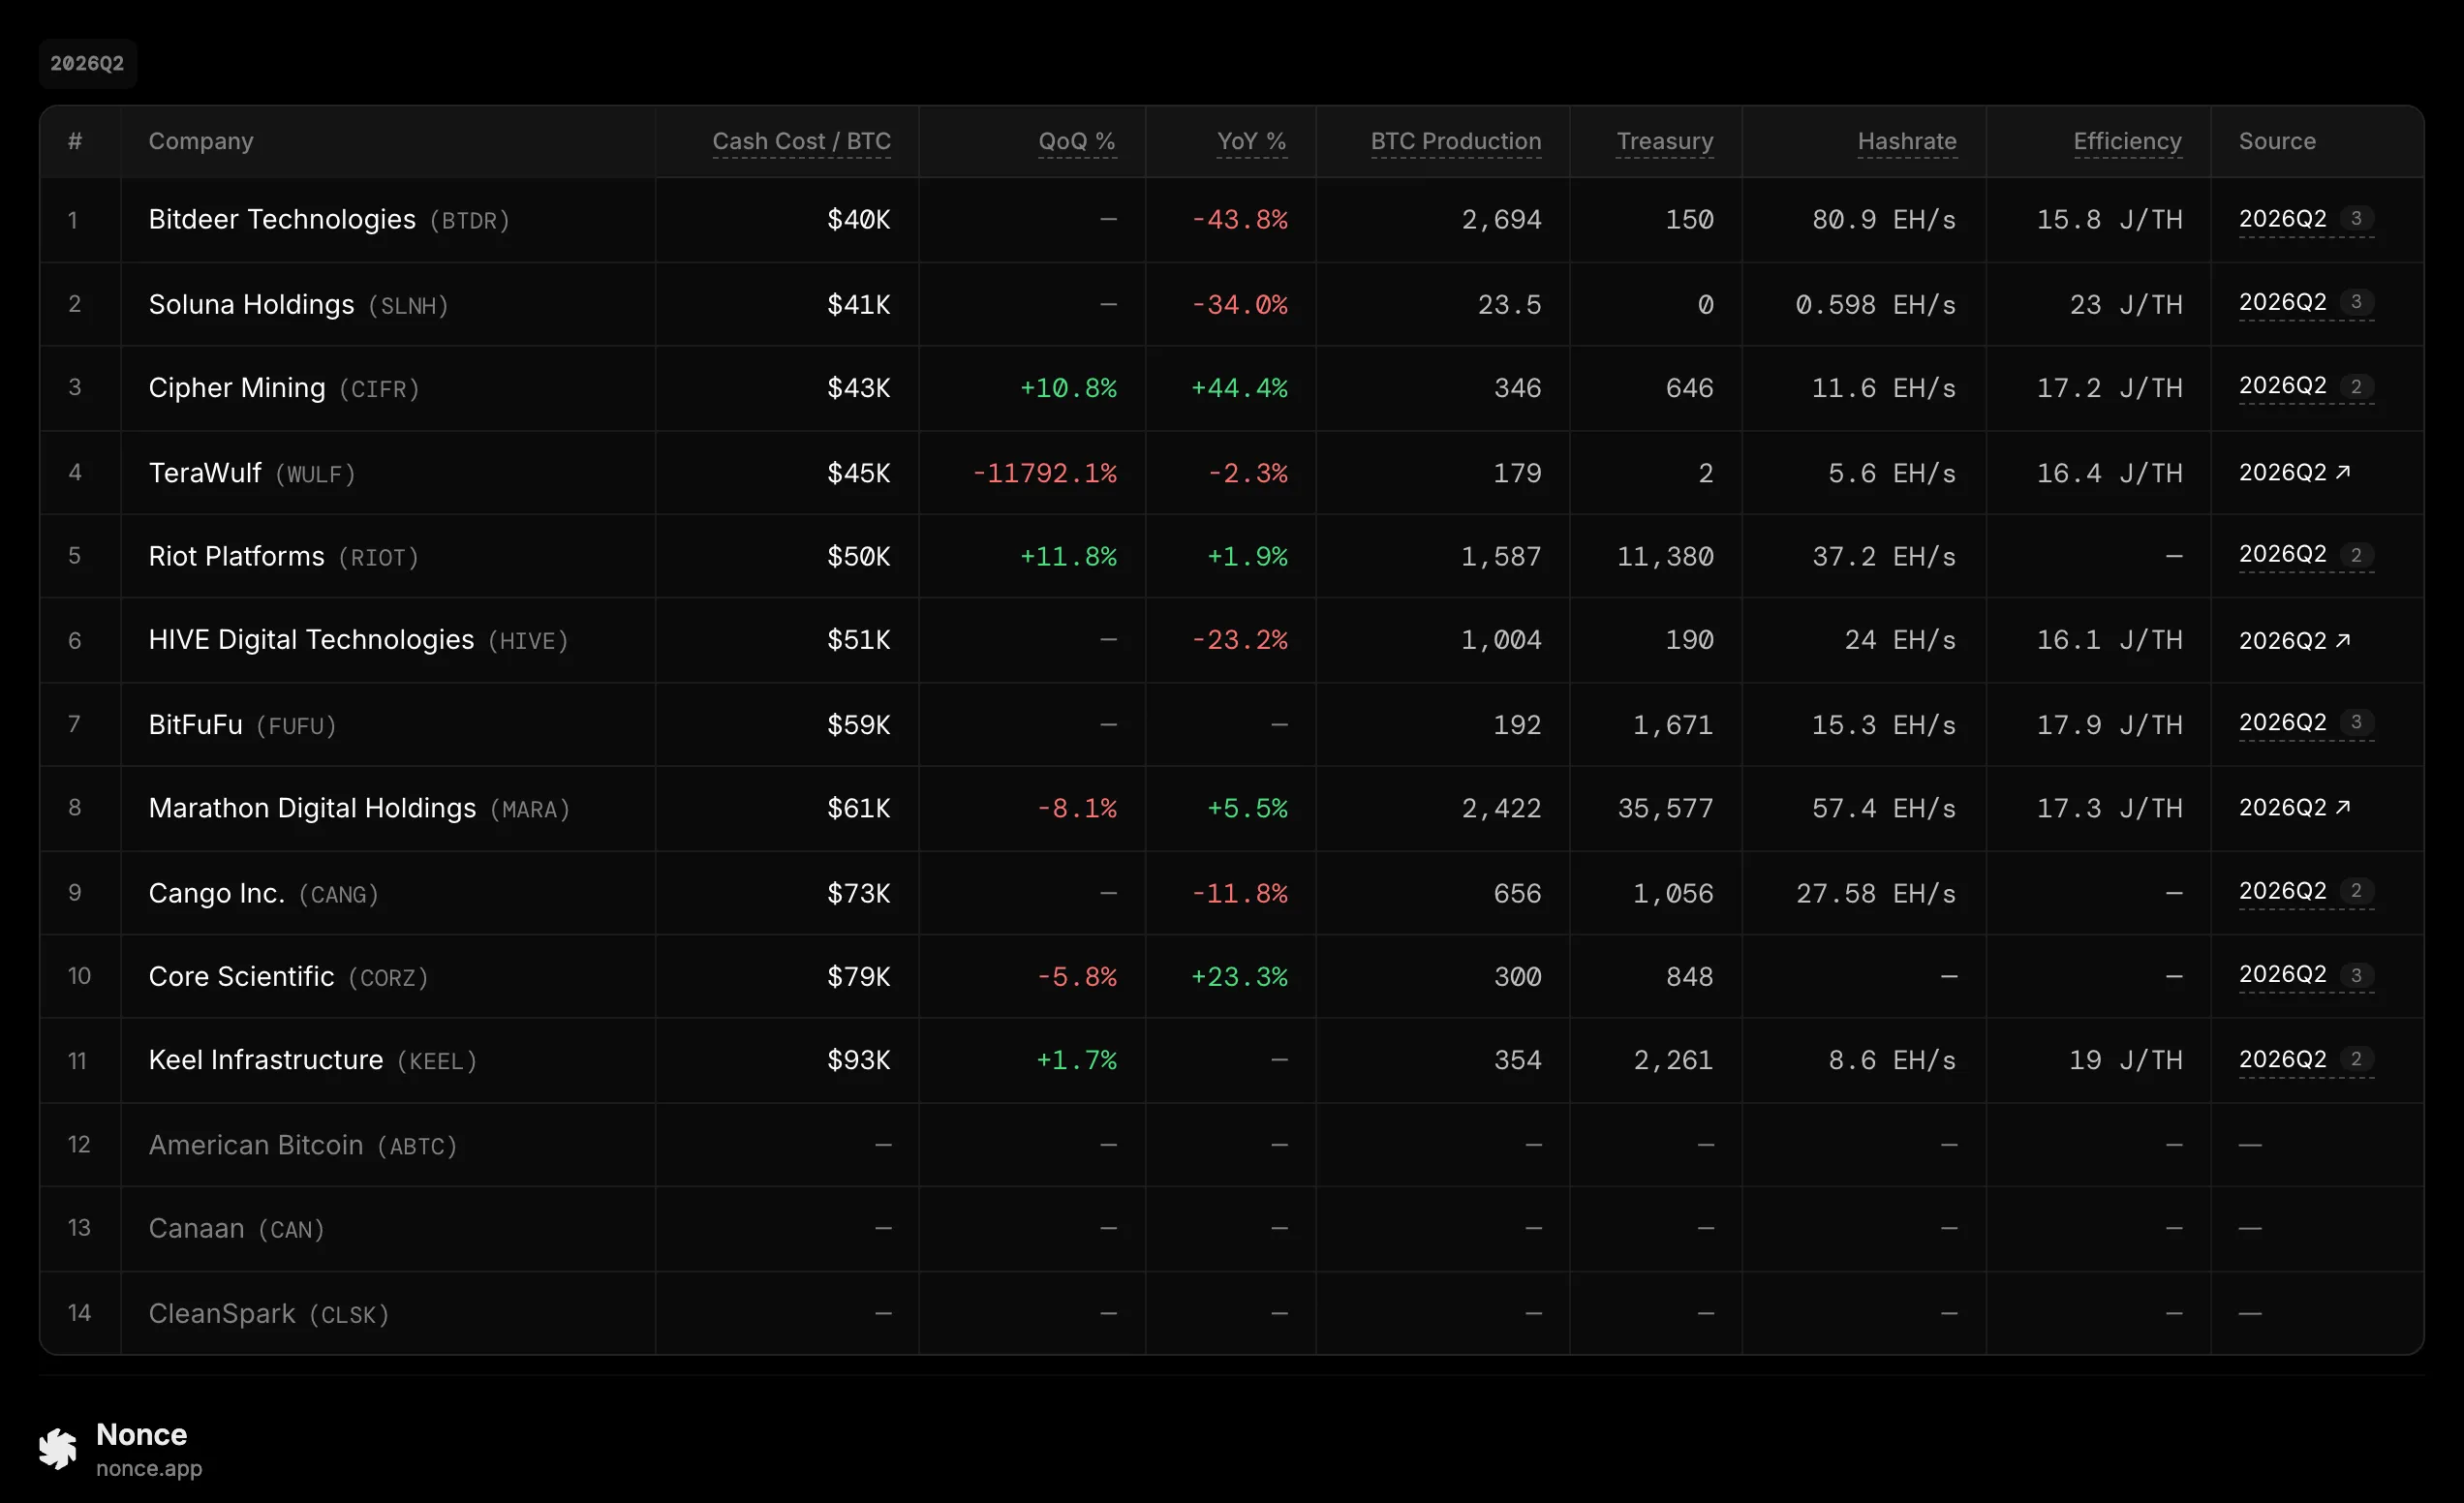
In public miner filings, one of the metrics most worth watching for farm operations teams is "how much it actually costs to mine one BTC."
But this metric is also the one least suited to direct cross-company comparison, because different companies use inconsistent cost definitions.
Taking the second quarter of 2026 as an example, MARA disclosed owned-site "power purchase cost per BTC" of $38,870, calculated as power purchase expense paid by the owned bitcoin mining business to electricity suppliers divided by corresponding BTC production. That figure is essentially close to "energy cost per BTC" and does not represent full production cost.
Riot discloses "cost to mine per BTC." Its second-quarter 2026 cost calculation includes self-mining power cost and other direct costs of revenue, then subtracts power curtailment credits, but excludes miner depreciation. Under that definition, Riot's cost to mine per BTC was $49,912; if miner depreciation is further included, the same-period cost reaches $90,631.
These two numbers clearly cannot be ranked directly, because they answer different questions.
| Cost metric | Common calculation | Main question answered |
|---|---|---|
| Energy cost per BTC | Farm power cost ÷ BTC production | How much power alone costs to produce one BTC |
| Direct operating cost per BTC | Power + direct ops and other cash costs ÷ BTC production | How much cash the farm needs to sustain production |
| Cash cost per BTC | Mining-related cash costs ÷ BTC production | The company's cash pressure to produce BTC |
| Cost per BTC including depreciation | Cash cost + miner depreciation, etc. ÷ BTC production | Full accounting cost to produce one BTC |
This is also what Nonce's analysis of public miner cost per BTC especially needs to distinguish: "power cost," "cash cost," "cost of revenue," and "cost including depreciation" disclosed by public miners are not the same metric. Only after unifying definitions does cross-comparison become meaningful.
Inside a farm, the metric easiest to align first with filings is actually energy cost per BTC. Energy cost per BTC = total electricity consumed in the reporting period × actual blended electricity price ÷ BTC production in the same period
For example, Bitdeer disclosed total electricity consumption of about 2.537 million MWh in the second quarter of 2026, an average electricity price of $44/MWh, and BTC production of 2,694. It is still necessary to further distinguish which power belongs to self-mining, joint mining, hosting, and other businesses—you cannot simply divide the company's entire electricity by BTC production—but it shows that public miner filing data can ultimately still be broken back into the underlying structure of "electricity × price ÷ production."
The Three Metrics Should Be Read Together, Not as Separate Rankings
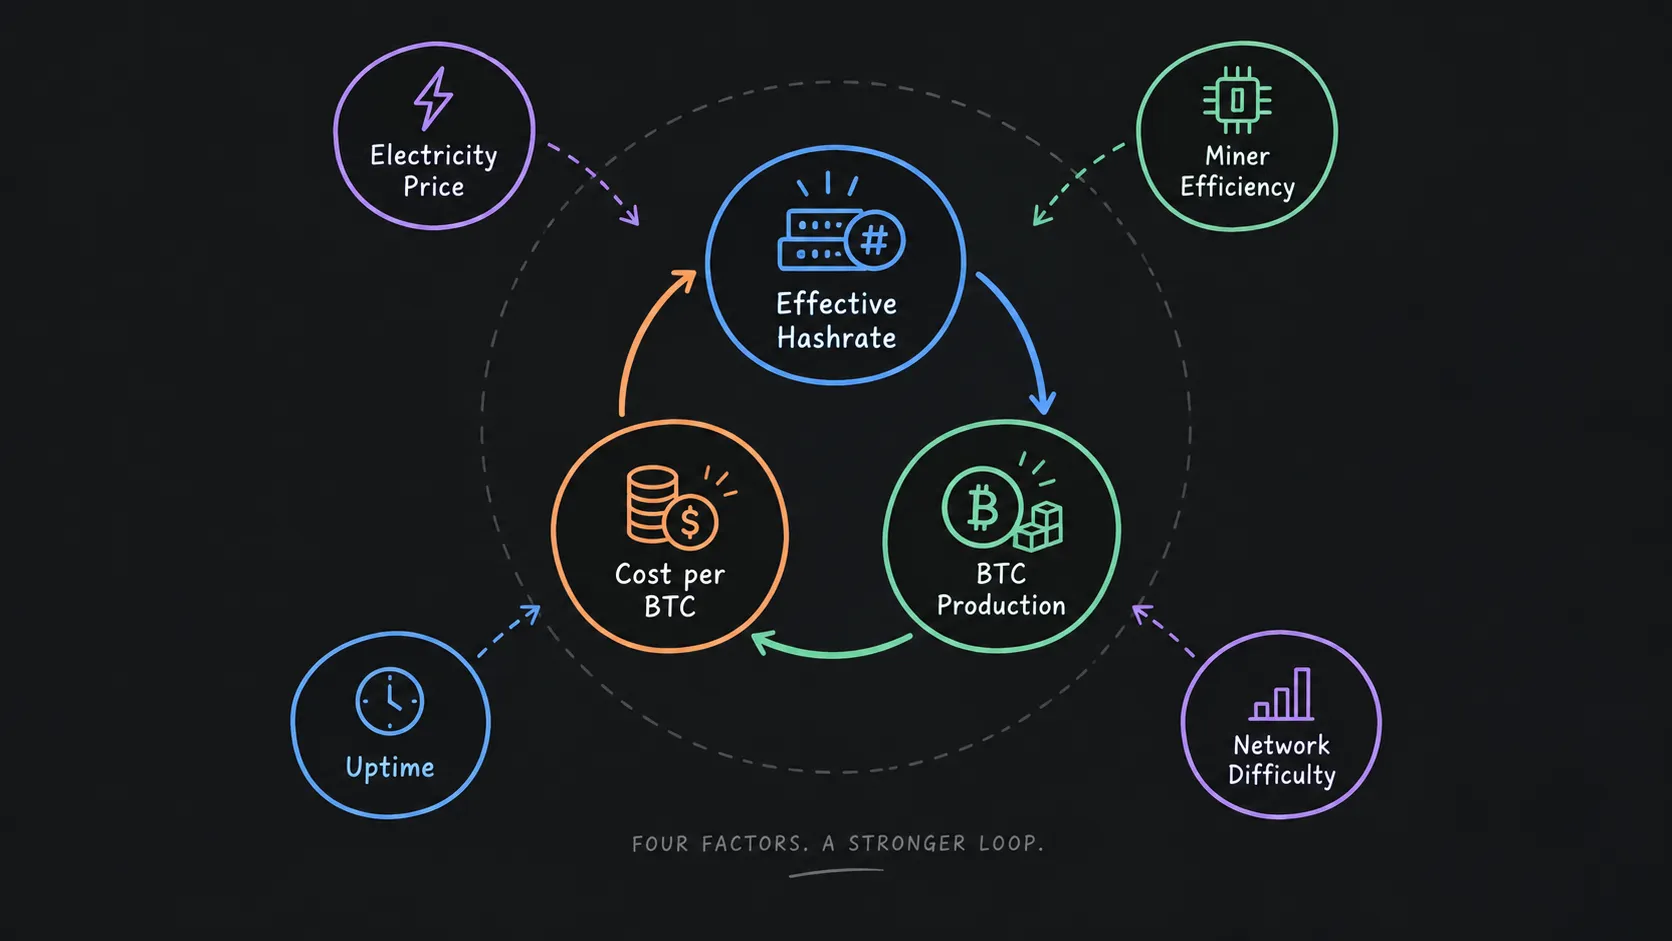
BTC production, effective hashrate, and cost per BTC actually form one complete operating chain.
Effective hashrate determines production capacity, production capacity affects BTC production, and BTC production determines how many BTC fixed costs and energy costs are ultimately spread across.
Suppose a miner adds no machines and electricity price is unchanged, but equipment failures cause effective uptime to fall from 98% to 90%. Quarterly average effective hashrate will decline. With network difficulty and other conditions roughly unchanged, BTC production falls accordingly. At the same time, labor, facility, infrastructure, and some power-related costs will not fall in the same proportion, so cost per BTC will instead rise.
Conversely, if device count is unchanged but the farm reduces offline miners, improves low-hashrate issues, and raises actual average hashrate, the same asset base may produce more BTC, some fixed costs are spread across more BTC, and cost per BTC ends up lower.
Therefore, when analyzing public miners, a more useful question than simply asking "who has the largest hashrate" is how many BTC did this company produce per unit of hashrate, and how much cost did it take to convert that hashrate into BTC?
That is also why Nonce public miner data puts BTC production, hashrate, electricity price, miner efficiency, and cost per BTC in one data system. In the second quarter of 2026, the Nonce data pages already covered multiple publicly listed miners and can compare BTC production, BTC holdings, hashrate, electricity price, cash cost, energy cost, power capacity, and miner efficiency at the same time.
Aligning Farm Data with Filings
When doing actual data analysis, definitions matter more than the formula itself.
First, unify reporting periods. Public companies usually disclose financial data by quarter, but different companies' fiscal years are not necessarily calendar years. For example, CleanSpark's "fiscal second quarter 2026" ended March 31, 2026, while other companies' "second quarter 2026" usually means April 1 to June 30. If you compare as soon as you see the words "Q2 2026," you may put two completely different periods together. CleanSpark's fiscal second-quarter 2026 results were published in May 2026, and the corresponding reporting period was the three months ended March 31.
Second, unify business boundaries. Self-mining, hosting, cloud hashrate, and joint mining cannot all be mixed together. If a company has 80 EH/s of total managed hashrate but only 50 EH/s is self-mining, then when calculating self-mining BTC production and cost per BTC you cannot directly use 80 EH/s.
Also unify cost boundaries. Which of electricity, farm staff, repairs, hosting, power curtailment credits, miner depreciation, and corporate overhead are included will significantly change the final "cost per BTC." Therefore, when analyzing public miners in the Nonce data system, first read the company's definition, then decide whether the data belongs to energy cost, cash cost, or a more complete accounting cost—rather than putting every figure labeled "Cost per BTC" into the same column.
Inferring Farm Operations from Filing Results: Three Metrics Form a Complete Data Language
For farm managers, the value of public miner filings is not only seeing which company earned more. More importantly, they provide a metric system that can reverse-validate farm operating quality.
BTC production answers "how much was ultimately produced," effective hashrate answers "how much continuously working compute capacity was truly put in," and cost per BTC answers "at what cost that production was achieved."
Offline miners, low hashrate, high temperature, abnormal power draw, device efficiency, and electricity price that farms see every day will not appear under the same names on a public miner's income statement, but those issues ultimately converge into three numbers: effective hashrate down, BTC production down, cost per BTC up.
Therefore, true data alignment is not mechanically copying one number from a farm dashboard into a quarterly report, but establishing a traceable relationship: miner status → effective runtime → effective hashrate → BTC production → energy and operating costs → cost per BTC.
When that chain can be recorded continuously, an ordinary farm can also observe itself with an operating perspective very close to public miners: no longer only asking "how many miners are online today," but further asking "how much effective hashrate did these miners contribute today," "how much BTC did that hashrate produce," and "how much did producing that BTC actually cost."
This is also a key step for farms moving from device management to data-driven operations. For Nonce, miner data and analysis provides an external industry benchmark, while a farm's own hashrate, device status, power, and operations data provide internal facts. Only when both sets of data are placed under the same "production, hashrate, cost" language does a farm truly have the basis to compare daily operations performance with public miner operating results.